Save DS18B20 Measurements to InfluxDB with Python
In this post i showed the basic setup of the DS18B20 sensor on Linux. Now lets do something with the data!
I decided to save it to InfluxDB, a database optimized for time series data, so perfect for saving temperature measurements. Compared to for example MySQL significantly faster. Also it does not require a static schema, this makes changing sensors and locations pretty easy. The installation is documented here, default config is fine for running it in the local network, it directly provides a nice HTTP API.
There is python module available to read and parse the measurements, named W1ThermSensor. When there is only one sensor connected use:
from w1thermsensor import W1ThermSensor

sensor = W1ThermSensor()
temp = sensor.get_temperature()
Or with multiple sensors:
sensors = W1ThermSensor.get_available_sensors()
indoor_sensor = sensors[0]
indoor_sensor.get_temperature()

outdoor_sensor = sensors[1]
outdoor_sensor.get_temperature()
For the influxDB connection there is also already a official influxdb module:
from influxdb import InfluxDBClient

client = InfluxDBClient(database='envDB')
This connects per default to localhost, make sure the specified database exist. Then build a array of dicts with the tags that describe this sensor, for example i use:
series = []
point = {
    "measurement": "temperature",
    "tags": {
        "location": "xyz",
        "room": "1",
        "usage": "sleeping",
        "type": "ds18b20"
    },
    "fields": {
        "value": indoor_sensor.get_temperature()
    }
}
series.append(point)

client.write_points(series)
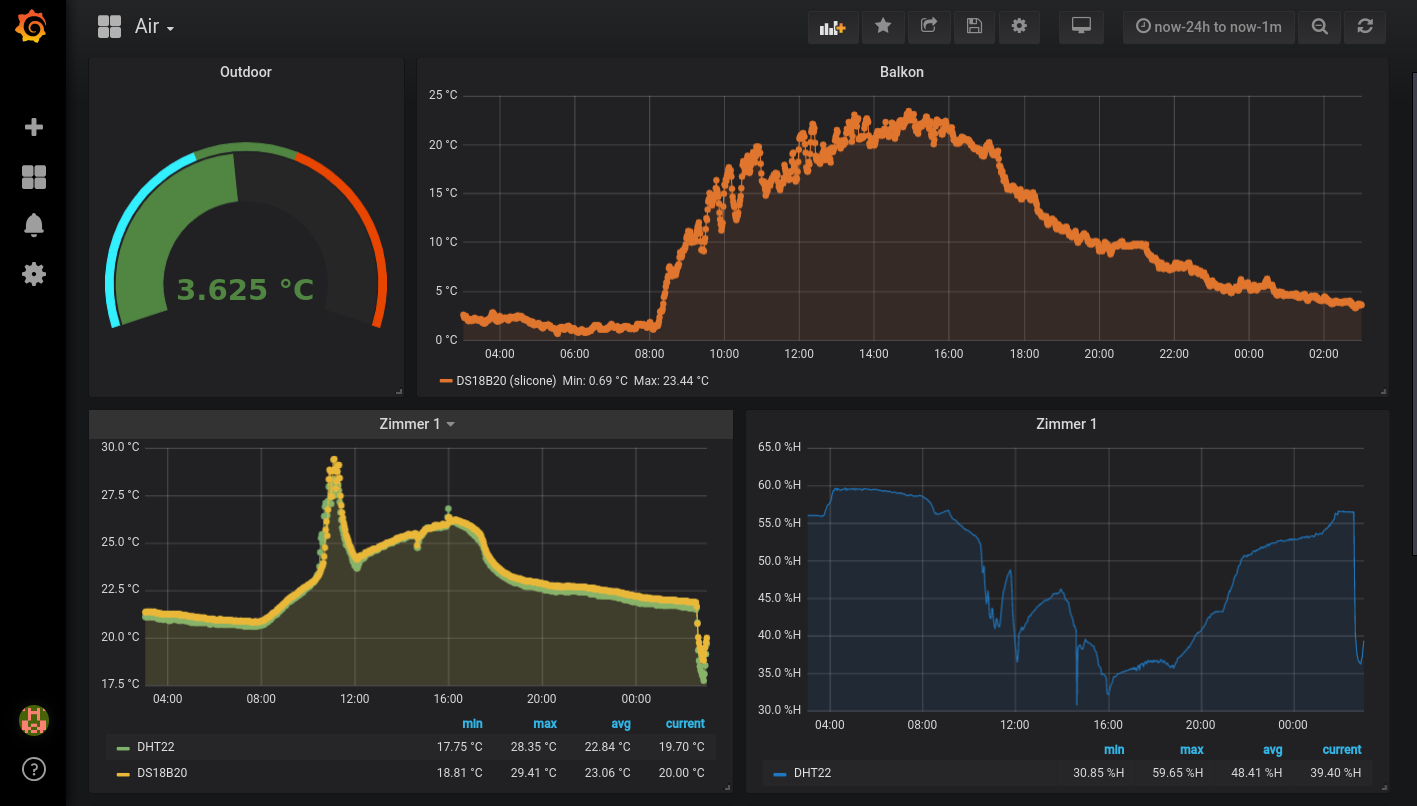
Visualization
To visualize the data Grafana is the way to go, this could look like this:
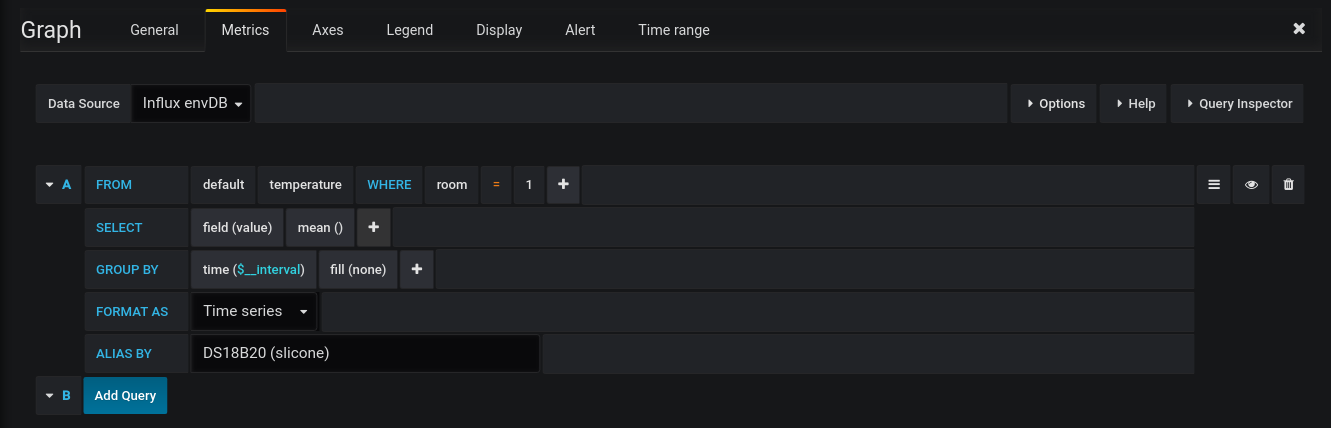
Just add the influxDB data source (if it runs on the same machine use http://localhost:8086), create a dashboard and add a graph panel, for example: