DS18B20 on OrangePi with Armbian
This post shows the basic setup of a DS18B20 digital temperature sensor on an OrangePi One running Armbian. The steps should be also similar on other SBCs running Armbian.
Armbian uses device tree overlys to enable additional hardware. For the general concepts take a look at the official docs. The available overlays reside in /boot/dtb/overlay/.
The DS18B20 communicates over OneWire, so we need the w1-gpio overlay. To enable it add to /boot/armbianEnv.txt:
overlays=w1-gpio
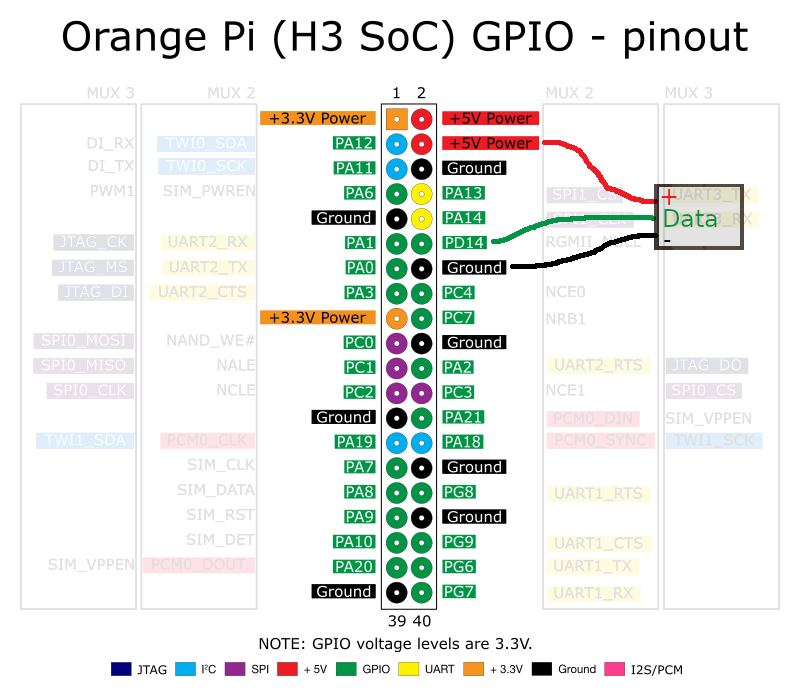
param_w1_pin=PD14
param_w1_pin_int_pullup=1
I used pin PD14 here, you can of course also chose other pins. The last line enables the internal pullup, if you plan to use a external pullup resistor then you can omit this line or set it to 0.
To actually read the sensor two kernel modules are required, add to /etc/modules-load.d/modules.conf:
w1-gpio
w1-therm
Then connect the sensor for example like this:
Now reboot and you should have a folder with the sensor ID under /sys/bus/w1/devices/. It contains a w1-slave file that can be read with the usual tools, for example with cat. At the end of the 2. line it has t= set to the calculated temperature in 1/1000 °C steps (millecelsius).
Example result:
3f 01 00 00 7f ff 7f 10 e8 : crc=e8 YES
3f 01 00 00 7f ff 7f 10 e8 t=19937
The sensor is per default set to 12 bit resolution, that is a bit 8 bit integer part and 4 bit fractions, so 1/16 = 0.0625 °C steps. The readout takes about 750 ms.
If such high resolution is not required it can can configured down (9-12bit bit), through directly writing to the w1_slave file, for example to set it to 10 bit (run as root):
echo 10 > /sys/bus/w1/devices/YOUR_SENSOR_ID/w1_slave
Then the conversion time scales linear with the resolution:
| Resolution | Steps | Time |
|---|---|---|
| 9 bit | 0.5 °C | 93,75 ms |
| 10 bit | 0.25 °C | 187,5 ms |
| 11 bit | 0.125 °C | 375 ms |
| 12 bit | 0.0625 °C | 750 ms |
Datasheet: https://datasheets.maximintegrated.com/en/ds/DS18B20.pdf
In the next post i will show a better method to parse the data with python, save it into a database and show visualizations.