OpenWRT Traffic Monitor with collectd and InfluxDB
This post shows how to log traffic (and other router health metrics) to a remote InfluxDB over the collectd protocol.
Prerequisites
- OpenWRT router
- SSH access
- about 200 KB free flash
- InfluxDB Server (runs on x86/64, ARM for example RaspberryPi)
- Optional/Recommended: Grafana Installation for Visualization
I used the latest openWRT snapshot as time of writing, collectd 5.8.1-3 and influxDB 1.7.4.
Following i cover the direct setup from command line, alternatively it is also possible to install the luci-app-statistics package and then configure it over the WebUI, this pulls RRDtool as dependency though, which is actually not required for this purpose. Overall this would require about double of the flash space, so i would not recommend it.
OpenWRT collectd setup
Connect per SSH and run the following commands.
Make sure the package lists are up to date:
opkg update
Install collectd:
opkg install collectd
Collectd has practically no functions builtin, everything comes as a plugin. There are 2 categories, input (read) and output (write) plugins. Let’s install some input plugins first:
opkg install collectd-mod-interface collectd-mod-ping collectd-mod-load
The interface plugin provides statistics about tx/rx bytes, packets, errors and drop rate. The ping plugin runs a ping in the specified interval. The load plugin just logs the system load as a one, five or fifteen minute average.
Then the output plugins:
opkg install collectd-mod-logfile collectd-mod-network
The logfile plugin allows to write logfiles from the daemon status. The network plugin can send the monitored data to a remote server, in this case the InfluxDB.
There are many more useful plugins available. Documented in collectd.conf(5) and the wiki.
OPKG also installs a default config file at /etc/collectd.conf. It specifies the plugin configuration, with a syntax similar to the Apache config, for example like:
# Config file for collectd. More info: https://collectd.org/
# Note: Luci statistics will generate a new config and overwrite this file.
BaseDir "/var/run/collectd"
Include "/etc/collectd/conf.d"
PIDFile "/var/run/collectd.pid"
PluginDir "/usr/lib/collectd"
TypesDB "/usr/share/collectd/types.db"
Interval    10
ReadThreads 2
WriteThreads 1


LoadPlugin "logfile"
LoadPlugin "network"

LoadPlugin interface
LoadPlugin load
LoadPlugin ping

<Plugin "logfile">
  LogLevel "debug"
  File "/var/log/collectd.log"
  Timestamp true
</Plugin>

<Plugin "network">
   # Export to an internal server
   Server "opi1"
</Plugin>


<Plugin interface>
#       IgnoreSelected false
#       Interface "br-lan"
</Plugin>

<Plugin ping>
        Host "1.1.1.1"
        Interval 30
        TTL 127
</Plugin>
Here we collect every 10s the data and ping every 30s. The log goes into /var, which is linked to a tmpfs, so the logs stay in RAM, this makes sense because writing to flash could decrease the lifetime. The Server section should contain the domain or IP of the target InfluxDB server. The interface content is commented out, so it uses the default of all interfaces.
Now to finally start it:
/etc/init.d/collectd start
Check the log at /var/log/collectd.log, it should say “Initialization complete” if everything works.
InfluxDB setup
InfluxDB provides out of the box support for the collectd protocol, it just needs to be enabled. Open the config at /etc/influxdb/influxdb.conf and enable it like this:
###
### [collectd]
###
### Controls one or many listeners for collectd data.
###

[[collectd]]
   enabled = true
   bind-address = ":25826"
   database = "openwrt"
   retention-policy = ""

  # The collectd service supports either scanning a directory for multiple types
  # db files, or specifying a single db file.
  # typesdb = "/usr/local/share/collectd"
  #
  security-level = "none"
  # auth-file = "/etc/collectd/auth_file"

  # These next lines control how batching works. You should have this enabled
  # otherwise you could get dropped metrics or poor performance. Batching
  # will buffer points in memory if you have many coming in.

  # Flush if this many points get buffered
  batch-size = 5000

  # Number of batches that may be pending in memory
  batch-pending = 10

  # Flush at least this often even if we haven't hit buffer limit
  batch-timeout = "10s"

  # UDP Read buffer size, 0 means OS default. UDP listener will fail if set above OS max.
  read-buffer = 0

  # Multi-value plugins can be handled two ways.
  # "split" will parse and store the multi-value plugin data into separate measurements
  # "join" will parse and store the multi-value plugin as a single multi-value measurement.
  # "split" is the default behavior for backward compatability with previous versions of influxdb.
  parse-multivalue-plugin = "join"
This is mostly default, i just changed the multivalue parsing to “join”, because it gives a cleaner DB, if backward compatability is not required. Also i use “openwrt” as DB name here, you can set this to whatever you want. No security because i run this only in the local network and the data is not really critical, you might want to enable signing and encryption if you have a different use case.
The last thing to do is copying the types.db from the router to the influxDB server. It contains definitions of the data types and must be preset also on the receiving server. Create the parent folder (following steps as root):
mkdir /usr/local/share/collectd
Then get it from the router with (replace ROUTER with the router domain/IP):
scp root@ROUTER:/usr/share/collectd/types.db /usr/local/share/collectd/types.db
Restart influxDB to reload the config, on systemd based systems:
systemctl restart influxdb
Now the data comes in an gets saved to the DB!
Grafana visualizations
Collectd sends the raw accumulated interface packets/bytes since boot, use the derivative transformation on 1s interval to get a nice bandwidth usage graph:
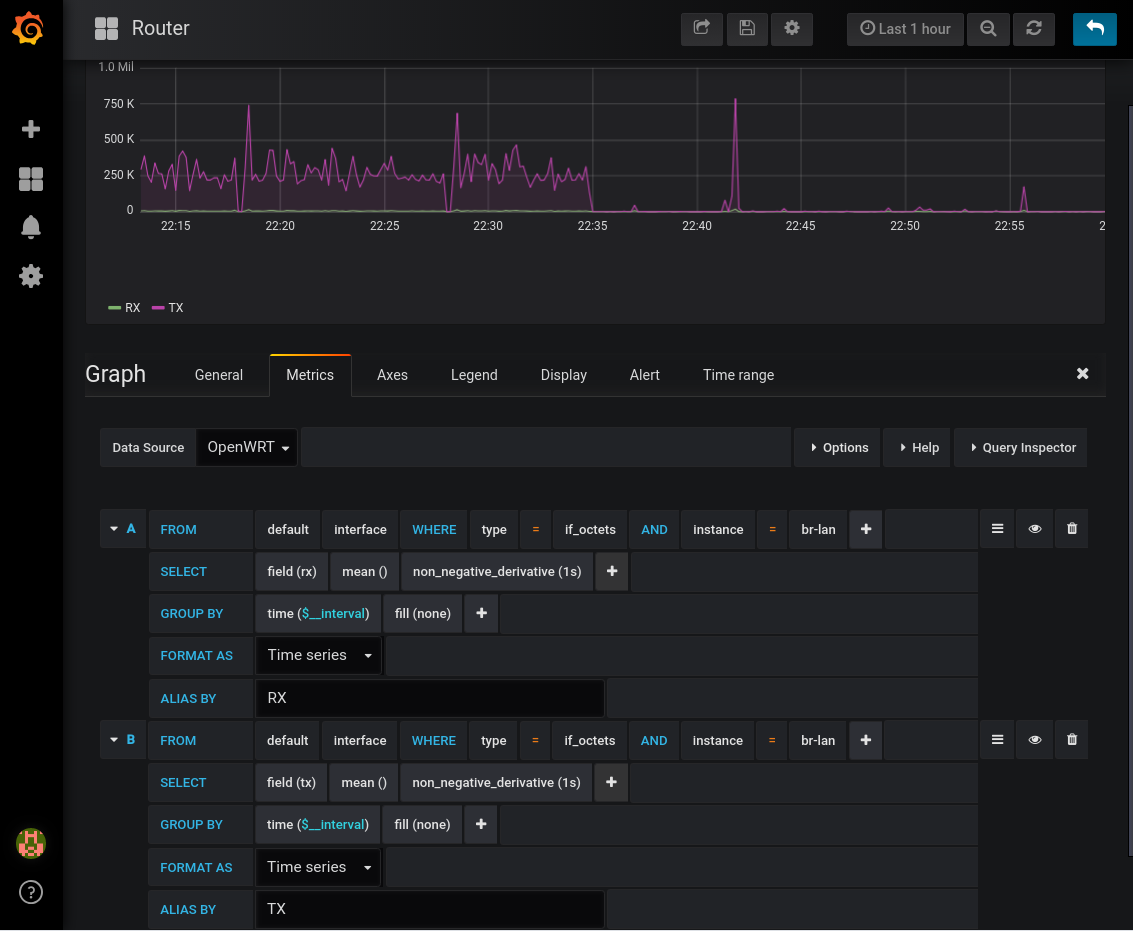
The ping and load plugin are similar, write measurements with the same name.
There is also a premade dashboard from another user available here.
Just go to Create - Import and put the ID in. It requires a few more plugins to work properly: collectd-mod-iwinfo collectd-mod-cpu collectd-mod-memory collectd-mod-uptime, after installing don’t forget to add the additional LoadPlugin directives in collectd.conf.
Also this dashboard was made for the older format, to get it working without editing all panels, change “parse-multivalue-plugin” back to “split” in influxdb.conf.