Grafana 5.0 with Volkszaehler MySQL data source
Add the MySQL datasource
Grafana supports in the standard installation already MySQL so just go to Configuration - Data Sources - Add data source and fill in the login information.
Note: It makes sense to create an additional database user with limited privileges, only SELECT on the Volkszaehler database is usually required. This can be done through phpMyAdmin (logged in as root).
Quick overview of the Volkszaehler database structure
There are only 2 tables really necessary for reading, data and properties:
data
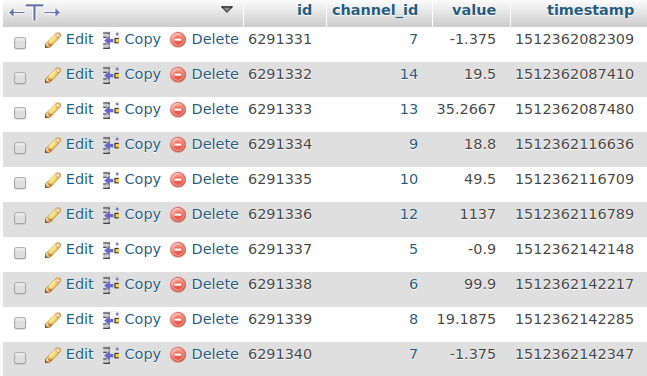
This is the main table, containing all measured values, with the timestamp (in UNIX format, milliseconds since 1970) and the corresponding channel ID. More information about the channel can be obtained from properties, which is linked to these channel IDs.
properties
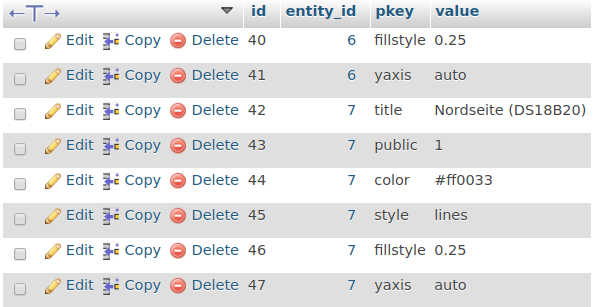
Entity ID is the same as the channel ID from data, so it is possible to get for example the title for all channels from this table.
List all channels in a Grafana table
This is a simple test that shows the ID with the titles, just create a new table panel in a Grafana dashboard and use the following query:
SELECT entity_id as ID, value as Name
FROM properties
WHERE pkey = "title"
Create graphs
Now finally to the graph panels! Create a new query as time series:
SELECT
  timestamp DIV 1000 as time_sec,
  value as value,
  "your channel name" as metric
FROM data
WHERE timestamp >= $__unixEpochFrom()*1000 AND timestamp <= $__unixEpochTo()*1000 AND channel_id = 5
ORDER by time_sec DESC
Grafana expects seconds (instead of the milliseconds in the database), so we have to divide the timestamps that we get by 1000, also multiply by 1000 the unix timestamp that Grafana sends in the WHERE clause. metric is getting displayed as legend under the graph, for simplicity here a static string (you can put anything you want), for a more elegant/complicated solution look at the chapter below. Also channel ID is harcoded to 5 here, make sure to change this to the channel you want. Lastly order descending it by the time.
Varibles to choose channels
Got to the dashboard settings -> Varibles, create a new one named sensor_title from the query
SELECT value FROM properties WHERE pkey = "title"
This shows all channel names, as you would expect, there is now a drop down menu a the top. Now we can use this variable to select only the values from the selected channel:
SELECT
  data.timestamp DIV 1000 as time_sec,
  data.value as value,
  "$sensor_title" as metric
FROM data
INNER JOIN properties
ON data.channel_id = properties.entity_id
WHERE properties.value = "$sensor_title" AND timestamp >= $__unixEpochFrom()*1000 AND timestamp <= $__unixEpochTo()*1000
ORDER by time_sec DESC
This is a bit more complicated, because the data table does not contain any titles, only the IDs, so the solution is to join it with the properties table, witch contains the channel/entity ID with the title, so we can select only the matching channels.
If there are any questions/suggestions feel free to write me an email (address in the footer)!